Our Reporting & Analytics Development Services
From executive dashboards to real-time data pipelines, every service we deliver is built for your specific data environment not a generic template applied to your numbers.

Encrypted InfoWeb delivers high-performing, custom reporting and BI platforms built for startups, SaaS companies, and global enterprises across the US, UK, Europe, Australia, and UAE. We transform raw operational data into fast-loading, beautiful, and actionable visualisations that eliminate manual overhead and drive measurable business growth across manufacturing, healthcare, ecommerce, fintech, and professional services, giving your team a distinct competitive advantage.
Book Free Consultation
10+ Years
Experience in digital delivery
200+ Projects
Across web, apps & software
Global Client Coverage
Global delivery & collaboration
NDA Ready
Confidential, IP-aware workflows
Reporting and analytics software development is the process of designing and building custom systems that collect, process, visualise, and distribute business data. These systems including dashboards, BI platforms, KPI trackers, and automated report generators convert raw operational data into structured insights that support decision-making at every level of an organisation, from frontline teams to executive leadership.
These are the data and reporting problems we hear most often and the exact scenarios our custom analytics solutions are built to fix.
Sales data lives in the CRM, financials in the ERP, and operations in spreadsheets. Leadership gets three different numbers for the same metric. We consolidate it all into one authoritative analytics layer.
Your team spends 5–10 hours per week pulling figures from different systems, formatting spreadsheets, and distributing reports that are stale by the time they arrive. We automate the entire cycle.
Month-end summaries and weekly exports are not fast enough when market conditions shift daily. We deliver real-time dashboards that give your leadership current, accurate visibility at any moment.
Power BI and Tableau are powerful but they impose their structure on your data. If your business logic is complex, custom-built analytics will always outperform a tool retrofitted to fit your workflows.
Your ERP, CRM, marketing platform, and helpdesk all track different slices of your business. Without integration, you can never see the full picture. We build data pipelines that connect everything.
You need to show clients performance data in a professional, branded interface but right now you send PDFs or screen-share raw dashboards. We build white-label reporting portals your clients actually trust.
Our Learning Management System development services are built for businesses that need more than what an off-the-shelf platform can deliver. Here is who we partner with most effectively.
You need in-product analytics and reporting features your customers expect. We build embedded dashboards, usage analytics, and white-label reporting modules that become part of your product not bolted on afterward.
Multiple departments, dozens of data sources, and leadership demanding a single source of truth. We build enterprise analytics platforms that consolidate operational data and deliver the executive visibility your organisation needs.
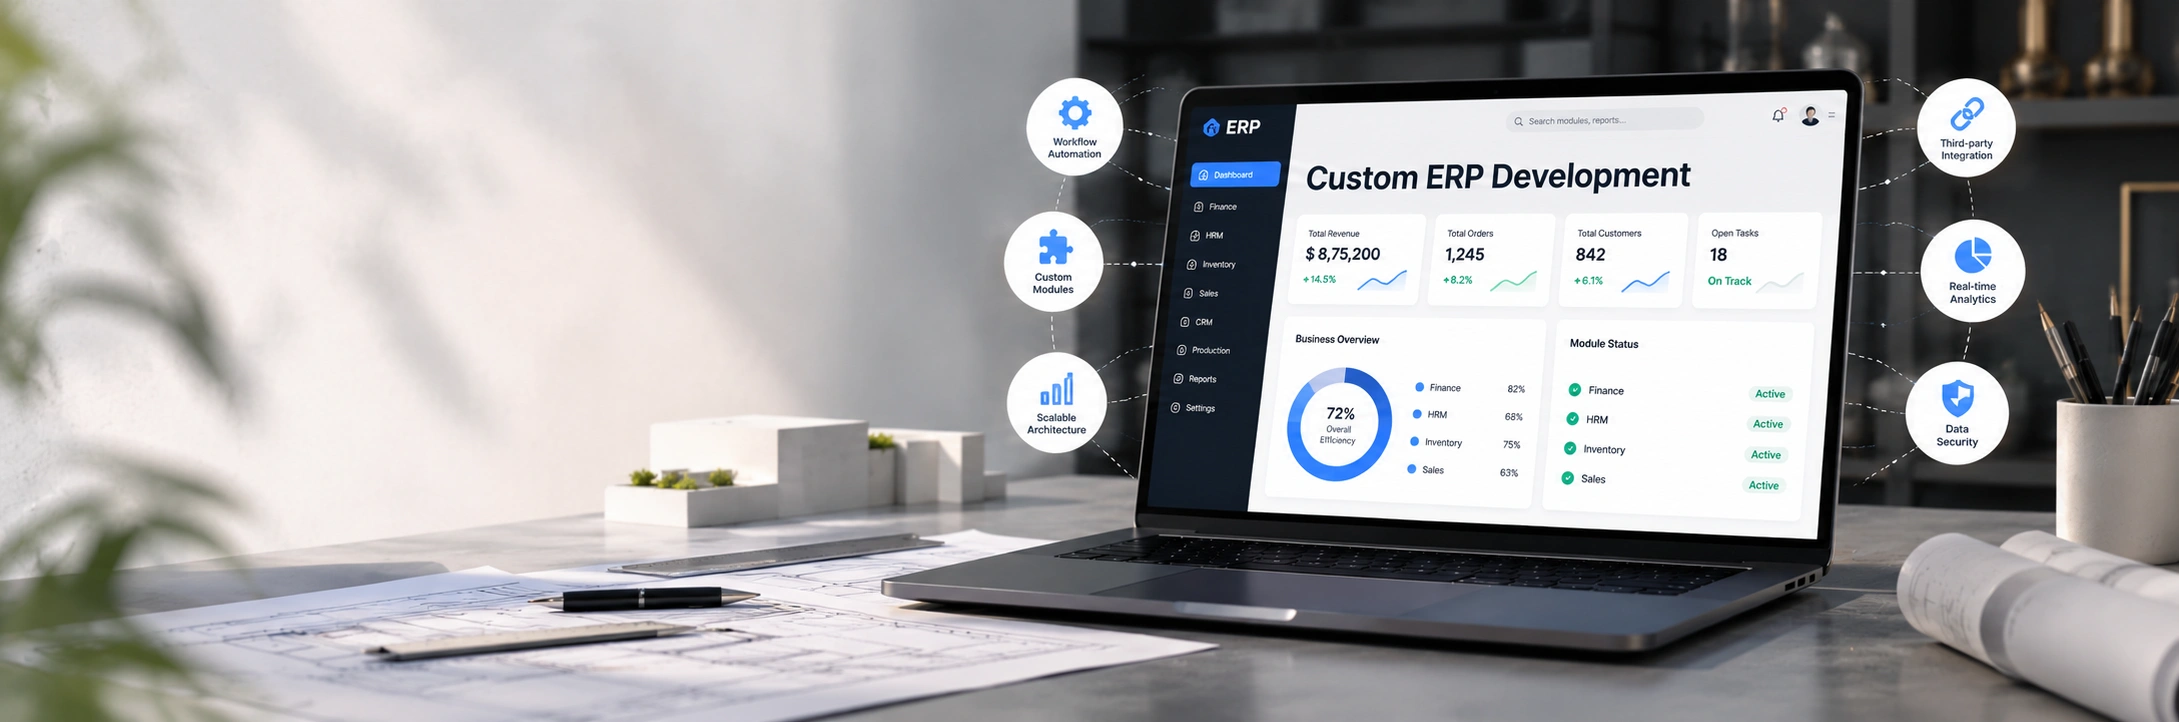
You have an ERP system but its built-in reporting is rigid and inadequate. We develop custom ERP reporting and analytics modules whether extending an existing system or building alongside it.
You need white-label reporting platforms to serve your clients. We build the reporting infrastructure that lets you demonstrate performance, justify retainers, and differentiate your service offering.
From executive dashboards to real-time data pipelines, every service we deliver is built for your specific data environment not a generic template applied to your numbers.

We design and build role-specific KPI dashboards that surface the metrics each user actually needs without forcing them to navigate through data they do not own. Sales managers see pipeline metrics. Operations teams see fulfilment data. Finance gets margin and cash flow. Everyone gets clarity.

We build custom BI platforms that go beyond standard reporting multi-dimensional data analysis, drill-down capabilities, trend forecasting, and cross-source data blending. Our business intelligence software development produces systems your analysts can actually work in without writing SQL every time they need an answer.
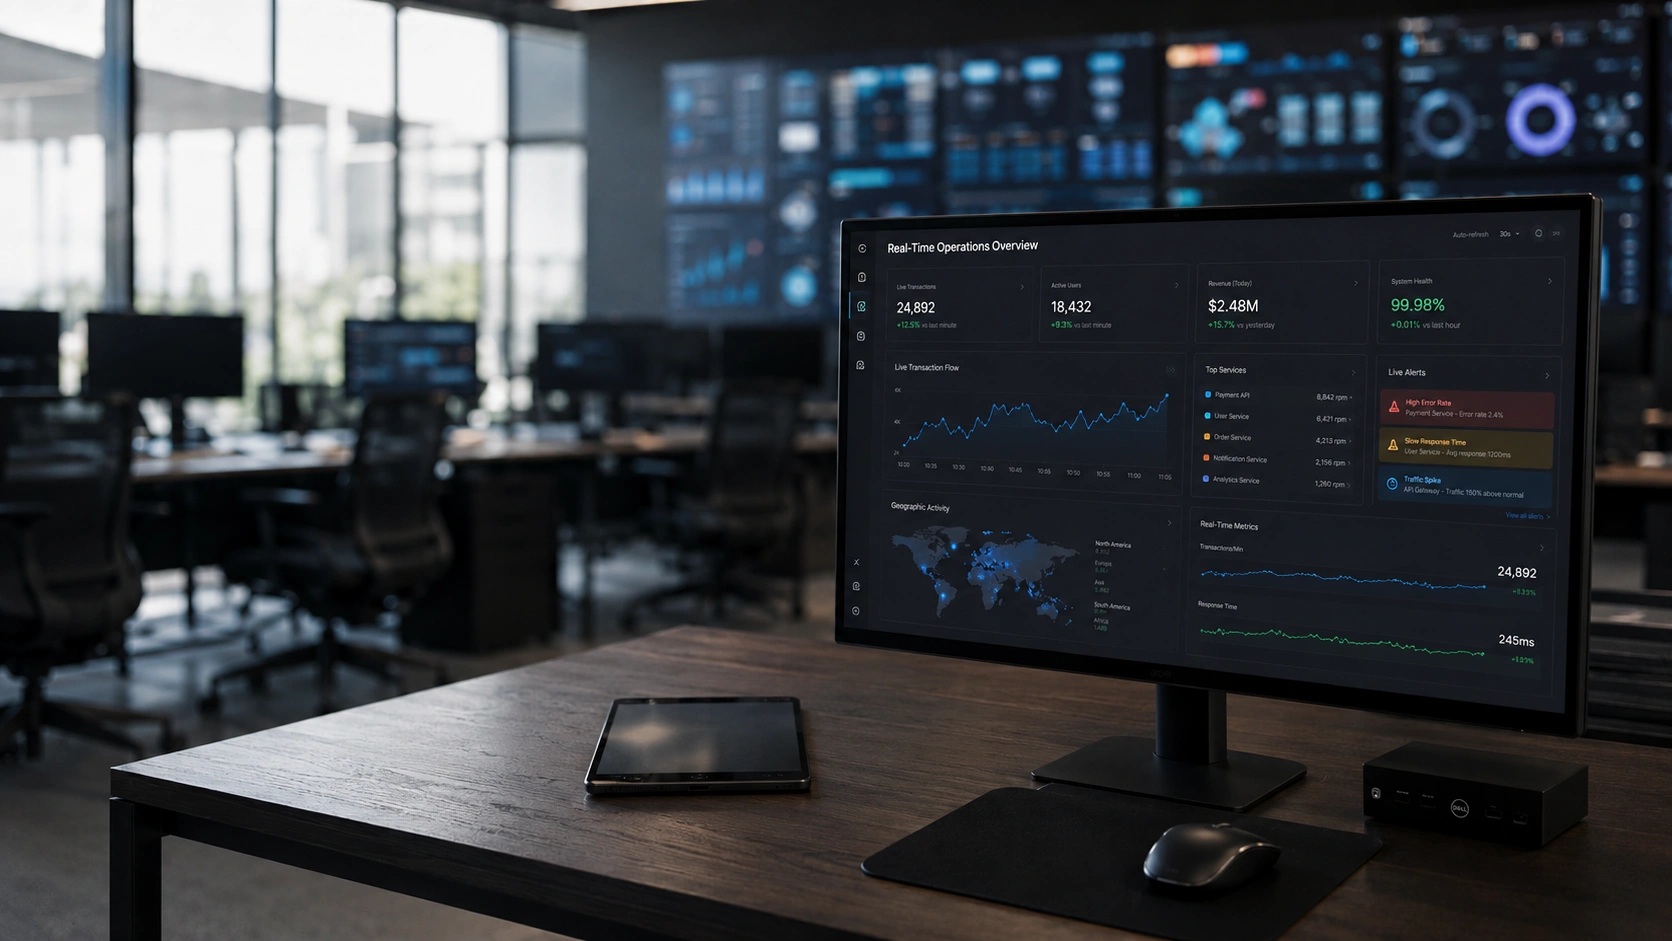
For businesses where operational data changes by the minute ecommerce order volumes, manufacturing output, live campaign performance we build real-time analytics engines that process and display data with near-zero latency. No refreshing. No stale reports.

Most ERP systems have reporting capabilities that are technically functional but practically unusable. We build custom reporting and analytics modules that sit within or alongside your ERP pulling the data your teams care about and presenting it in formats that drive action. This is a natural complement to our broader ERP development services.

Leadership needs clarity, not complexity. We develop executive dashboards and automated board reporting tools that consolidate cross-departmental performance into a single, clean view scheduled reports, narrative summaries, and visual performance indicators that enable confident decision-making at the top level.
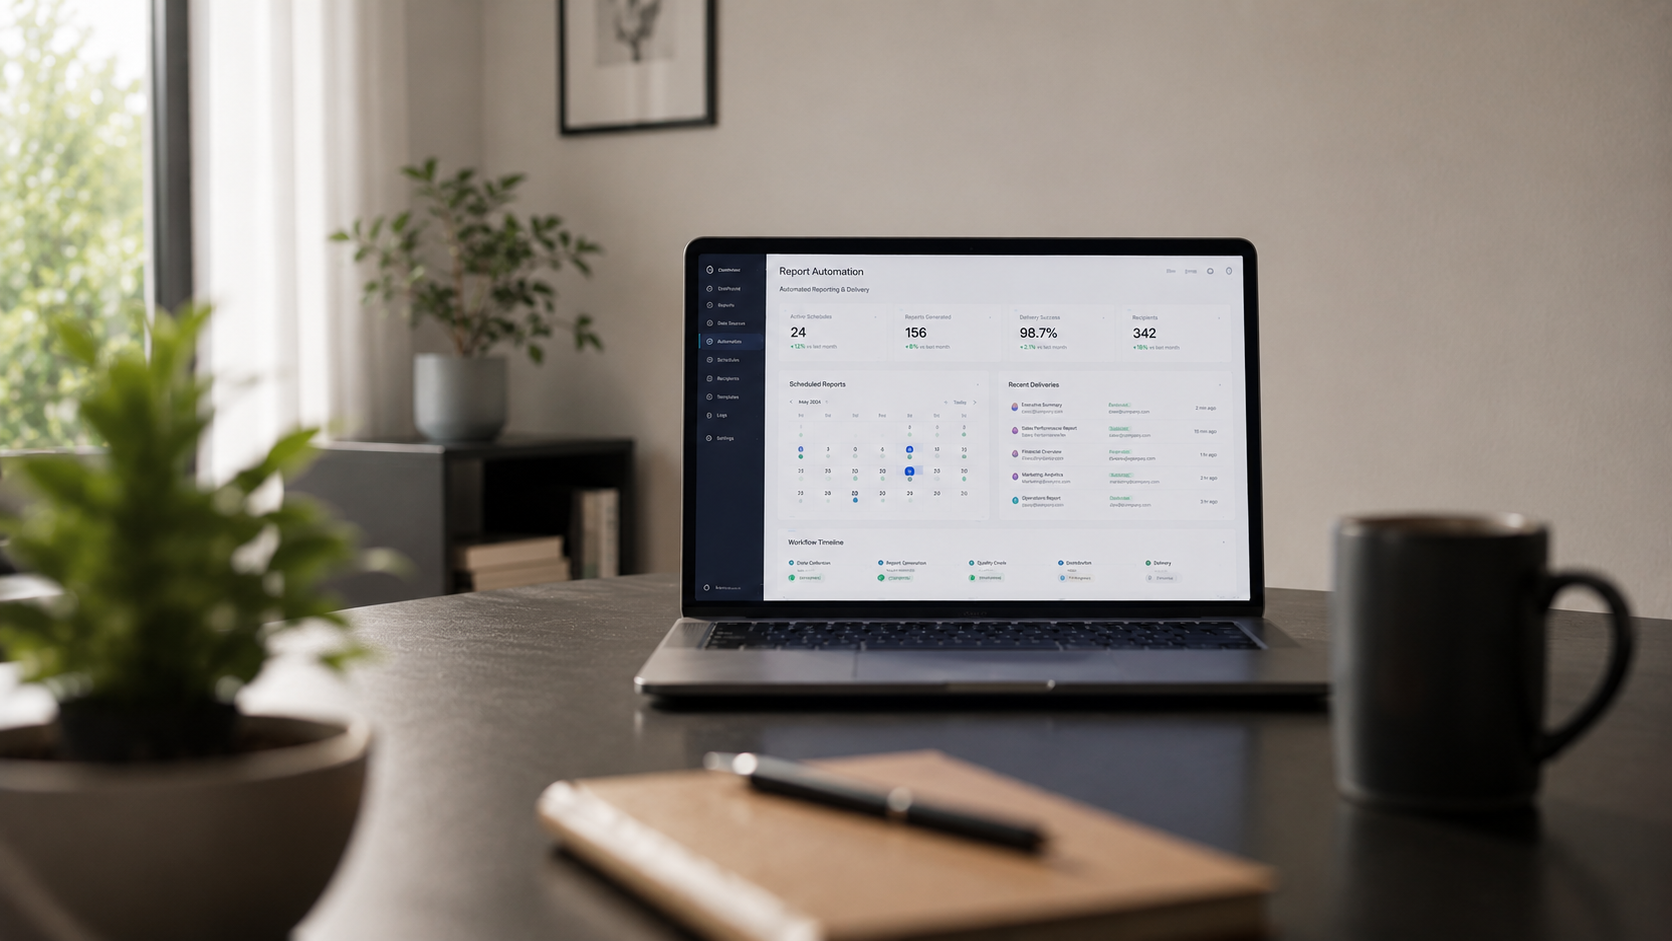
We build reporting automation systems that eliminate manual report generation entirely. Scheduled generation, automatic distribution by email or portal, conditional alerts when KPIs breach thresholds, and audit-ready data trails. If your team spends hours each week building reports that should just arrive, we fix that.
A proven, five-phase process refined across 200+ projects. Every engagement starts with understanding your business before any design or code begins.
We map your existing data sources, systems, and the decisions your teams need to make. We sign an NDA before any discussions begin. Outputs include a data architecture overview, a stakeholder reporting matrix, and a defined scope document with no ambiguity about what gets built.
Our UI/UX design team produces wireframes and high-fidelity mockups of every dashboard view. We present three design approaches, iterate based on your feedback, and get sign-off before development begins. No guesswork mid-build.
We build the data pipelines, backend processing logic, and frontend dashboard interfaces in two-week sprints. You receive working previews at the end of each sprint not a big-bang reveal after months of silence. Our web development and frontend development teams work in parallel for efficiency.
We validate every data point against source systems, run performance load tests, check cross-browser dashboard rendering, and conduct end-user acceptance testing with your team. Analytics software is only useful if the numbers are trusted and that trust is earned through rigorous validation.
We deploy to your infrastructure or managed cloud environment, provide full user documentation, and conduct onboarding sessions for your team. Post-launch support packages cover performance monitoring, feature extensions, data source additions, and ongoing optimisation.
We select tools based on your performance requirements, data volumes, and existing infrastructure not convenience. Every technology choice is deliberate.


There is no shortage of developers who can connect a database to a chart library. Here is what actually separates us and why businesses across the US, UK, Germany, and UAE keep coming back.
We have built analytics solutions across healthcare, manufacturing, SaaS, logistics, fintech, and ecommerce. That domain knowledge changes how we design because we understand what data is actually relevant in your industry, not just how to display it.
Analytics software fails when users cannot quickly understand what they are looking at. Our UI/UX design team specialises in information architecture and data visualisation dashboards that communicate, not just display.
We architect analytics systems for the data volumes you will have in three years, not just today. Proper data modelling, efficient query optimisation, and scalable infrastructure mean your system grows with your business rather than being replaced by it.
A dashboard that takes 30 seconds to load is a dashboard that gets ignored. We optimise every query, index every relevant data structure, and build efficient caching layers so your analytics are fast enough to be useful in real-world workflows.
Our clients span the US, UK, Germany, Australia, UAE, and Singapore. We understand the compliance expectations, data privacy requirements (GDPR, HIPAA, DSGVO), and commercial dynamics that vary by market and we build accordingly.
Two-week sprints, shared project access, weekly milestone updates, and direct communication with your project lead. No black-box development periods. You see progress continuously and can adjust direction without disrupting the build.
We bring sector-specific domain knowledge to every project. How data flows and what decisions it needs to support varies significantly by industry and our solutions reflect that.
Embedded product analytics, usage dashboards, customer health scoring, and churn prediction reporting.
Patient flow analytics, clinical KPI dashboards, HIPAA-compliant reporting modules, and operational efficiency tracking.
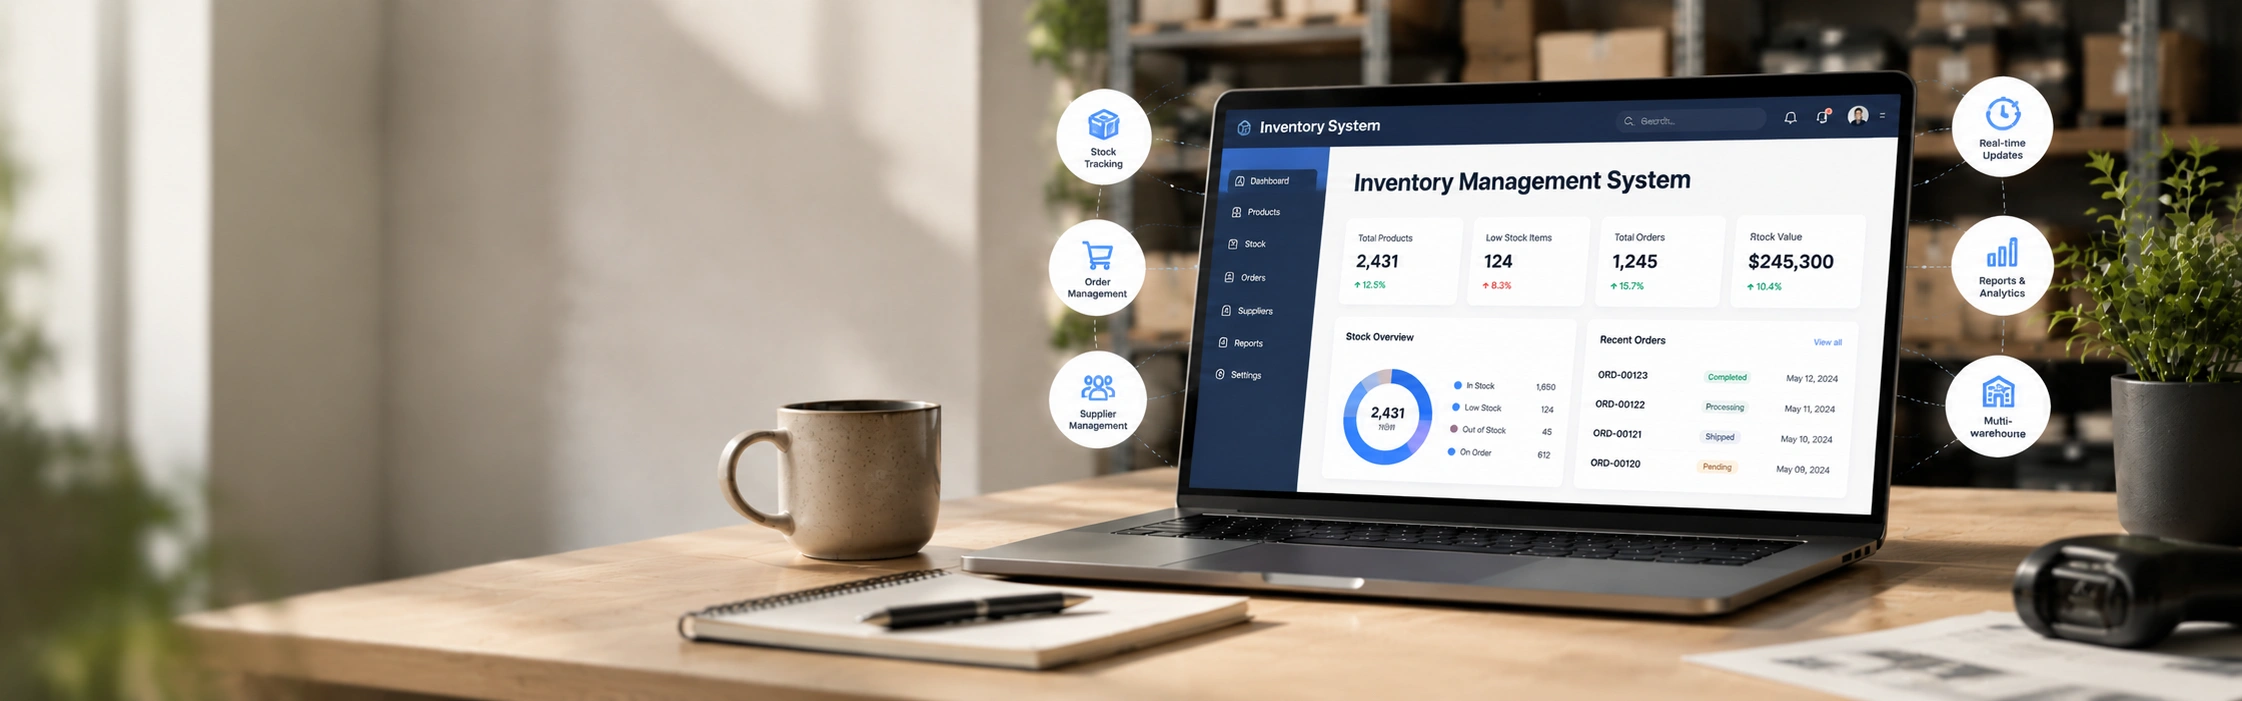
Real-time sales dashboards, inventory analytics, customer lifetime value tracking, and marketing attribution reporting.
OEE dashboards, production output analytics, supply chain reporting, and ERP data integration layers.
Portfolio performance dashboards, regulatory reporting automation, risk analytics, and client reporting portals.
Cross-departmental KPI consolidation, board reporting automation, and executive analytics platforms.
Our delivery model is remote-first and built for international collaboration. We serve clients across time zones with consistent engineering quality, clear communication, and process maturity that matches or exceeds in-house teams.
US clients need analytics platforms that handle large-scale data volumes, integrate with Salesforce and HubSpot ecosystems, and deliver the executive dashboards American leadership teams expect. We serve businesses across New York, San Francisco, Austin, and Chicago with full US timezone overlap.
UK analytics projects require GDPR-compliant data architectures, ICO-aligned data handling, and reporting formats British B2B clients trust. We serve businesses in London, Manchester, Birmingham, and Edinburgh with GMT-compatible delivery and clear documentation at every stage.
German clients expect rigorous technical documentation, DSGVO-compliant data pipelines, and audit-ready reporting systems. We deliver analytics solutions built to the precision and documentation standards that Mittelstand businesses require serving Frankfurt, Berlin, Munich, and Hamburg.
Australian analytics projects connect to local ERP and accounting platforms, support ATO-aware financial reporting, and run on async-first workflows with AEST overlap for critical reviews. We work with Sydney, Melbourne, and Brisbane businesses on data infrastructure that scales with growth.
UAE businesses need analytics platforms with Arabic language support, multi-currency AED dashboards, and FTA-compliant financial reporting views. We serve businesses in Dubai, Abu Dhabi, and across the GCC with full remote delivery and Arabic localisation where required.
For Indian businesses, GST-aware analytics and IRP-compliant e-invoicing reporting is a core specialisation. For wider APAC clients, we handle multi-jurisdiction tax reporting, multi-currency dashboards, and integrations with regional ERP and payment platforms across Southeast Asia.
Let's design a reporting and analytics platform that gives your team genuine visibility and your leadership the data confidence to make faster, better decisions.
.webp)

.webp)